SeqCVIBE
SeqCVIBE is an R Shiny web application for the interactive exploration, analysis, visualization and genome browsing of big RNA-Seq datasets. SeqCVIBE offers a real-time interface and allows for several on-the-fly visualizations and calculations, such as averaging genomic tracks over specific regions of the genome and calculating RNA abundance in custom potentially non-annotated regions (e.g., novel long non-coding RNAs). In addition, SeqCVIBE is simultaneously a database for pre-analyzed data, where the user can navigate and explore results, as well as perform a variety of basic on-the-fly analyses and export the outcomes.
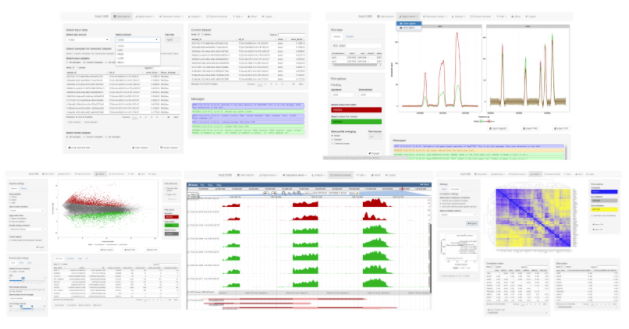
Within SeqCVIBE users can:
- Create, edit, delete, load and subset pre-analyzed RNA-Seq datasets to study issues such as dataset subgrouping as related to differential gene expression signatures.
- Visualize RNA-Seq signals by simply defining the genes or genomic areas of interest either by name or by genomic coordinates and hitting a button. Figures can be exported in various formats. Track-like figures are also available. RNA-Seq signal averaging and visualization on-the-fly are among the unique features of SeqCVIBE.
- Calculate and explore RNA-Seq gene expression signal values on-the-fly, including non-annotated areas (e.g. novel lncRNAs) by providing genomic coordinates.
- Perform on-the-fly differential expression analysis with interactive exploration, filtering and exporting of the results.
- Additional gene expression analyses such as various gene- or sample-wise correlations and hierarchical and k-means clustering, Principal Component Analysis and Multidimensional scaling.
- Genome browsing of RNA-Seq signals
Availability:
- Source code in GitHub
- An implementation in the framework of Elixir-GR